Ask AI any U.S. housing market question. Get investor-grade answers in seconds.
Lotlytics plugs real estate data directly into Claude, Cursor, and any AI tool via MCP —894 markets, 21,500+ ZIP codes, forecasts, migration, climate risk, and investment scores. Free to start.
Paste a property link. Get an investor verdict.
Lotlytics gives your AI the market context to tell you whether a property is actually worth pursuing — in seconds, not hours.
I found this property on Zillow — 3bd/2ba in Memphis, TN listed at $185,000. Is this a good rental investment?
zillow.com/homedetails/1847-Nelson-Ave-Memphis-TN...
Try it yourself — free for the top 50 markets
Everything you need to invest with confidence
Nine integrated modules. 894 markets. Works inside your AI tools.
Market Intelligence
200+ data points per market. Prices, inventory, days on market, rental yields, and 50+ indicators across 894 US markets.
Price Forecasting
ML-powered 12-month forecasts with confidence intervals. Not predictions — projections backed by Zillow ZHVF data.
Market Screener
Filter 894 markets by yield, appreciation, affordability, and risk. Find your next investment in minutes.
Investment Calculator
Model rental ROI, mortgage payments, cash-on-cash returns, and cap rates with real market data pre-filled.
Climate Risk Scoring
Flood, fire, storm, and heat risk integrated into every market profile. Know the true cost of ownership.
Migration Flows
IRS county-to-county migration data. See exactly where people and wealth are moving — and why it matters for prices.
Market Comparison
Compare up to 4 markets side by side across 20+ metrics. Make the call with confidence, not gut feel.
Economic Indicators
Employment, wages, GDP, and industry breakdown per market. Understand the fundamentals driving real estate.
AI + MCP Integration
Ask Claude, Cursor, or any AI assistant about any market. Lotlytics plugs directly into your AI workflow via MCP.
Real estate data, inside your AI tools
Connect Lotlytics to Claude, Cursor, or any MCP-compatible AI assistant. Ask questions in plain English and get live market data instantly — no dashboards, no tabs.
Example prompts
"Is Dallas TX a good market to invest in right now?"
Free"Compare Nashville vs Charlotte for rental investing"
Free"Find markets in Texas under $250k with yield above 5%"
Investor"Analyze this deal: $275k, 3bd/2.5ba, Arlington TX — 187 Zillow saves, is it a good investment?"
Investor{
"mcpServers": {
"lotlytics": {
"type": "streamable-http",
"url": "https://lotlytics-mcp-production.up.railway.app/mcp"
}
}
}// Claude + Lotlytics response:
DFW market: Neutral (4.6/10) — prices -3.9% YoY, 5.2 months supply. Gross yield 5.48% → net 3.79% after $5,589/yr tax.
⚠️ Tax trap: Zillow shows $3,365/yr (2023). Actual 2025 bill: $5,872 — up 58%. That's $210/mo more than most investors model.
Verdict: 187 saves = retail demand, not motivated seller. Skip as wholesale/flip. As rental at $2,100/mo: ~5.5% net yield — workable if you model real taxes.
— Lotlytics via ClaudeHow we compare
| Feature | Lotlytics | Zillow | HouseCanary | Mashvisor |
|---|---|---|---|---|
| Markets Covered | 894 CBSAs | All US | Limited | Limited |
| ZIP-Level Data | 21,500+ ZIPs | |||
| Price Forecasts | ||||
| Demographics (30+ cols) | ||||
| Affordability Index | ||||
| Climate Risk (FEMA) | ||||
| Migration Analysis | ||||
| Market Comparison | ||||
| Investment Calculator | ||||
| Data Sources | 9+ | Proprietary | Proprietary | 3-4 |
| API Access | Investor ($79/mo) | Enterprise | From $500/mo | From $100/mo |
| Free Tier | ||||
| Starting Price | $0 | $0 | $500/mo | $50/mo |
What you get
Institutional-grade data, built for individual investors
Every market profile includes price trends, rental yields, migration flows, climate risk, investment scoring, and ZIP-level breakdowns.
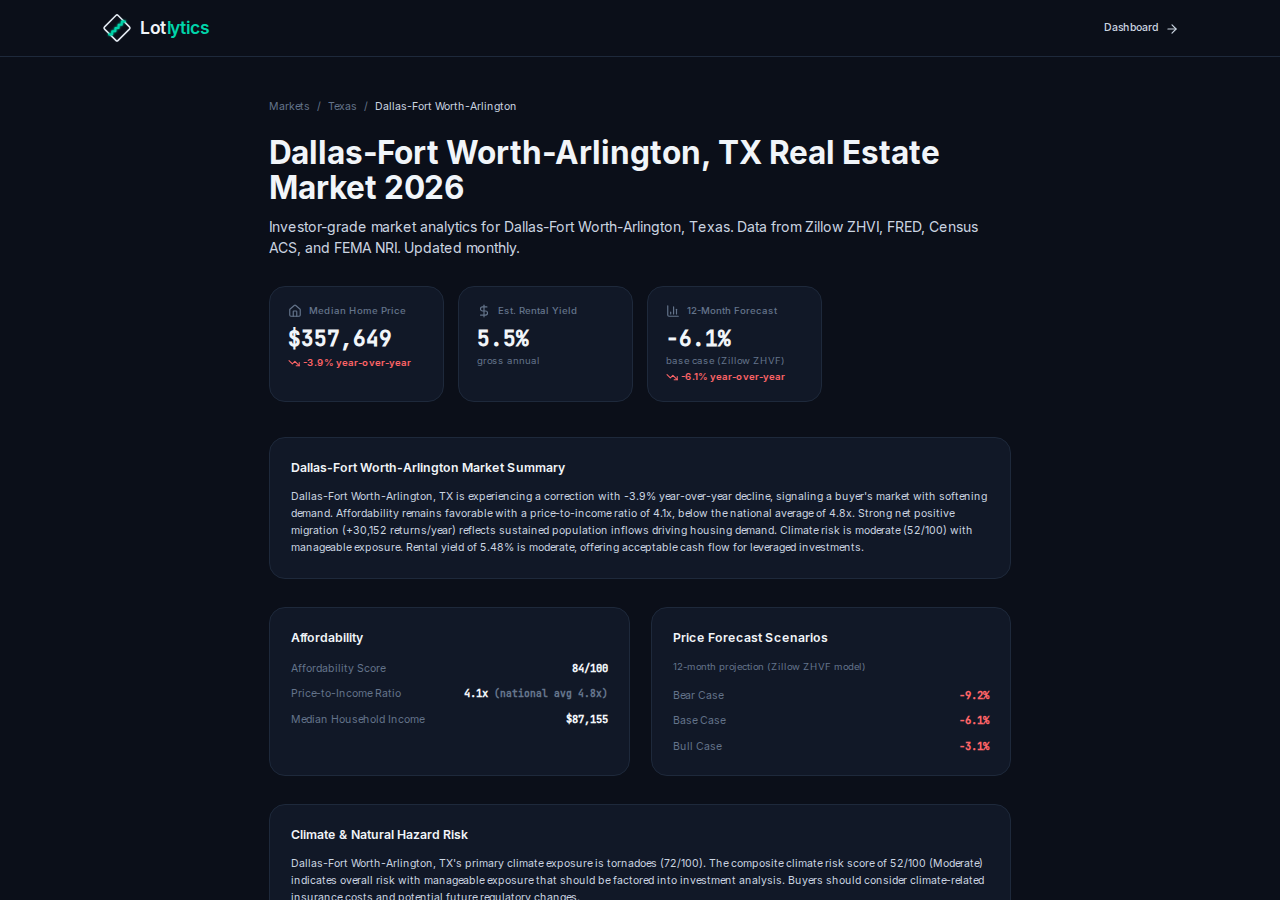
Dallas–Fort Worth market profile — one of 894 markets tracked
Simple, transparent pricing.
Start free. Scale when you're ready.
Free
Explore the basics
- Top 50 US markets
- Basic price history (12 months)
- National market overview
- Free MCP server (Claude, Cursor)
- 1 saved market
Pro
For serious researchers
- All 894 US markets
- Full price history + forecasts
- Migration & demographics data
- Rental yield estimates
- 10 saved markets
- Email support
Investor
For active investors
- Everything in Pro
- Market Screener (filter 894 markets)
- PDF market reports
- Developer API access (1,000 calls/mo)
- Premium MCP server (all 894 markets)
- Priority support
- 50 saved markets
Enterprise
For teams & firms
- Everything in Investor
- Custom API limits
- Dedicated support
- Custom data exports
- SLA guarantee
Frequently asked questions
We aggregate from 9+ public sources including FRED, Census ACS 5-Year, Zillow ZHVI/ZORI, Redfin, BLS LAUS, FEMA NRI, HMDA, IRS SOI migration, and QCEW employment data. All updated monthly.
We track 894 CBSA regions — US metropolitan and micropolitan statistical areas — covering virtually every US metro. Plus 21,500+ ZIP codes with neighborhood-level home value data.
Our forecasts are powered by Zillow's ZHVF model, which covers 12 months of forward projections. We always show confidence intervals, not point predictions.
Yes. No contracts, no cancellation fees. Your data and saved analyses remain accessible on the Free tier.
Not yet. We currently cover all US metro and micropolitan areas with ZIP-level detail. Canadian markets are on our roadmap.
Price, rental, and market data updates monthly. Economic indicators (FRED, BLS) update monthly. Census demographics update annually. All automated via CI/CD.
Yes. We offer 50% off Pro for verified students and registered nonprofits. Contact support with verification.
Get weekly real estate market insights
Data-driven analysis on the markets worth watching. No spam, unsubscribe anytime.